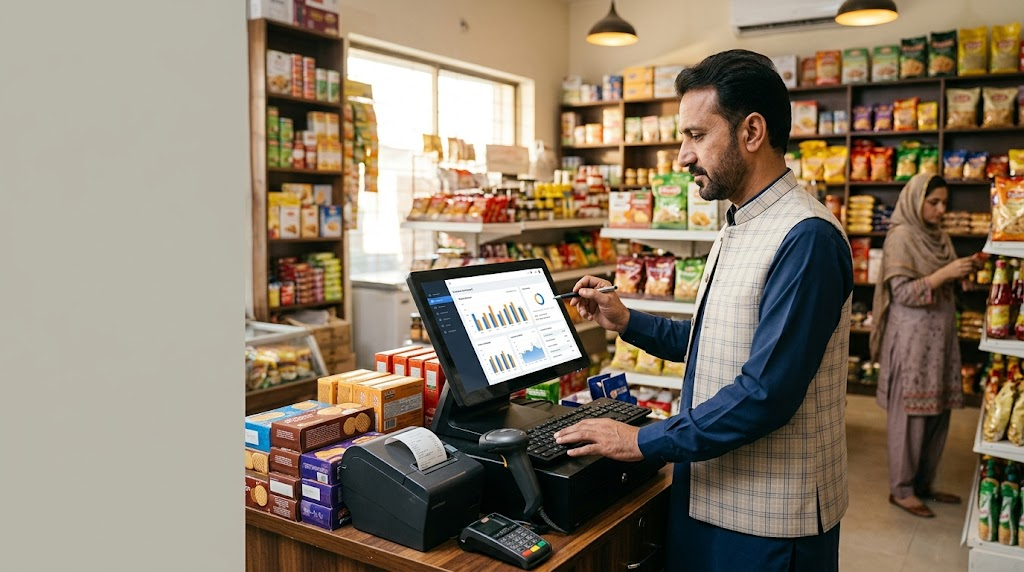
A modern POS system is, among other things, a continuous survey of your customers' behaviour. Every sale, every return, every time someone walks in and buys nothing — your POS is recording it.
Most Pakistani businesses collect this data but never look at it. Here are five reports that, if reviewed every Monday morning for 10 minutes, will quietly grow your revenue and improve your margins.
1. Sales by hour of day
When are you busiest? When are your staff standing around?
Most shop owners in Pakistan think they know the answer. The data usually surprises them. You might assume the evening rush starts at 6 PM, but your POS data might show that 40% of your daily revenue actually comes between 1 PM and 3 PM.
What to do with this data:
- Schedule more staff during your actual peak hours, not the ones you assume
- Run promotions during slow hours — a "2-4 PM happy hour" can fill dead time
- Decide opening and closing times based on when customers actually shop, not tradition
Sabify's analytics dashboard shows sales by hour in a simple chart. No spreadsheets, no manual counting.
2. Your top 20% of products
A well-known retail pattern: roughly 80% of your revenue comes from 20% of your products. The exact list is specific to your business — and it changes over time.
What to do with this data:
- Make sure you never run out of these items. Set reorder points and keep safety stock
- Give them the best shelf placement — they already convert, so make them easy to find
- Do not waste prime shelf space on slow movers
- Promote them on your e-commerce website if you sell online
Sabify's product performance report shows your best sellers sorted by revenue, quantity, or profit. You can filter by date range, category, or branch.
3. Average transaction value (ATV)
ATV is the average amount each customer spends per visit. This is one of the most powerful levers for growing revenue because it does not require more customers — just better transactions.
Example: If your ATV is Rs. 800 and you serve 100 customers a day, your daily revenue is Rs. 80,000. Increasing ATV to Rs. 900 — a 12.5% lift — takes your daily revenue to Rs. 90,000 with zero extra foot traffic.
How to increase ATV:
- Bundles: "Buy a shirt and get a belt at 30% off" moves more units per transaction
- Upsells: Train staff to suggest one relevant add-on per customer
- Minimum order incentives: "Spend Rs. 1,000 and get free delivery"
- Loyalty tiers: Higher spenders get better rewards, encouraging larger baskets
Sabify's customer loyalty tools let you set up tiered rewards, bulk discounts, and targeted promotions — all tracked automatically.
4. Customer repeat rate
What percentage of your customers this month have shopped with you before? In healthy Pakistani retail businesses, this number is 40-60%. If yours is below 30%, you have a leaky bucket — you are good at attracting customers but losing them after the first visit.
What to do with this data:
- Collect phone numbers at checkout — Sabify POS can register customers by phone number in seconds
- Send follow-up WhatsApp messages — a simple "Thanks for your purchase, here is 10% off your next visit" works
- Run loyalty programs — Sabify's loyalty card system rewards repeat purchases automatically
- Track purchase history — know what each customer buys and when, so you can suggest relevant products
5. Margin by product
Revenue is vanity; margin is sanity. A product doing Rs. 500,000 a month in revenue at a 5% margin generates Rs. 25,000 profit. A product doing Rs. 100,000 at 40% margin generates Rs. 40,000. The second product is more valuable despite lower revenue.
What to do with this data:
- Review margins monthly, not just at year-end
- Renegotiate supplier prices for thin-margin products
- Adjust retail prices where the market allows
- Stop promoting products that sell well but barely make money
Sabify's financial reports show margin by product, category, and branch. Combined with QuickBooks integration, your accountant gets accurate data without manual entry.
How to make this a habit
Pick one report. Every Monday morning, spend 10 minutes looking at it and asking: what changed since last week, and what should I do about it?
After a quarter of doing this, you will be running your business on data instead of gut feel. The difference is dramatic — and it compounds over time.
Start with the right tools
Sabify surfaces all five of these reports out of the box — no spreadsheets, no manual data entry, no separate analytics software. Everything is in one dashboard, accessible from your phone, tablet, or desktop.
Schedule a demo and we will walk you through these reports on your own business data. You can also explore Sabify's complete feature set or see our pricing plans.
Tags
Written by
Sabify Team
Business Growth
Sharing practical insights on POS systems, retail technology, and business growth in Pakistan.
Frequently Asked Questions
What POS reports should I check every week?
How do I increase average transaction value in my shop?
Can Sabify POS generate these reports automatically?
Related Posts
 POS Systems
Choosing the Right POS System for Your Business in Pakistan
A step-by-step guide to picking a POS system that actually fits your Pakistani business — covering hardware types, must-have features, and the vendor questions most owners forget to ask.
 Business Tips
FBR E-Invoicing: What Pakistani Businesses Need to Know in 2026
FBR e-invoicing is now mandatory for most sales-tax registered businesses in Pakistan. Here is what the rules say, what your POS needs to do, and how to avoid common compliance mistakes.
 Restaurants
How POS Systems Transform Restaurant Operations in Pakistan
From table management to kitchen tickets to direct online ordering, a modern restaurant POS changes how every shift runs. Here is what the best Pakistani operators automate — and what they do not.